

Data and Analytics with AI
A Beginner's Guide
- •

Introduction
We live in a world overflowing with information. Every click, every purchase, every social media post creates data. But data on its own is just noise — the real value is obtained only when we turn that data into insights. That’s where analytics comes in.
With Artificial Intelligence (AI), data analytics has become faster, smarter, and more powerful than ever. Whether it’s Netflix recommending your next binge-watch, Google Maps predicting traffic, or your bank catching suspicious transactions, AI is working behind the scenes for the analysis of vast data.
What is Data Analytics?
Collecting, transforming and organising data to make predictions, draw conclusions and drive informed decision making using math, statistics, and computer science is data analytics.
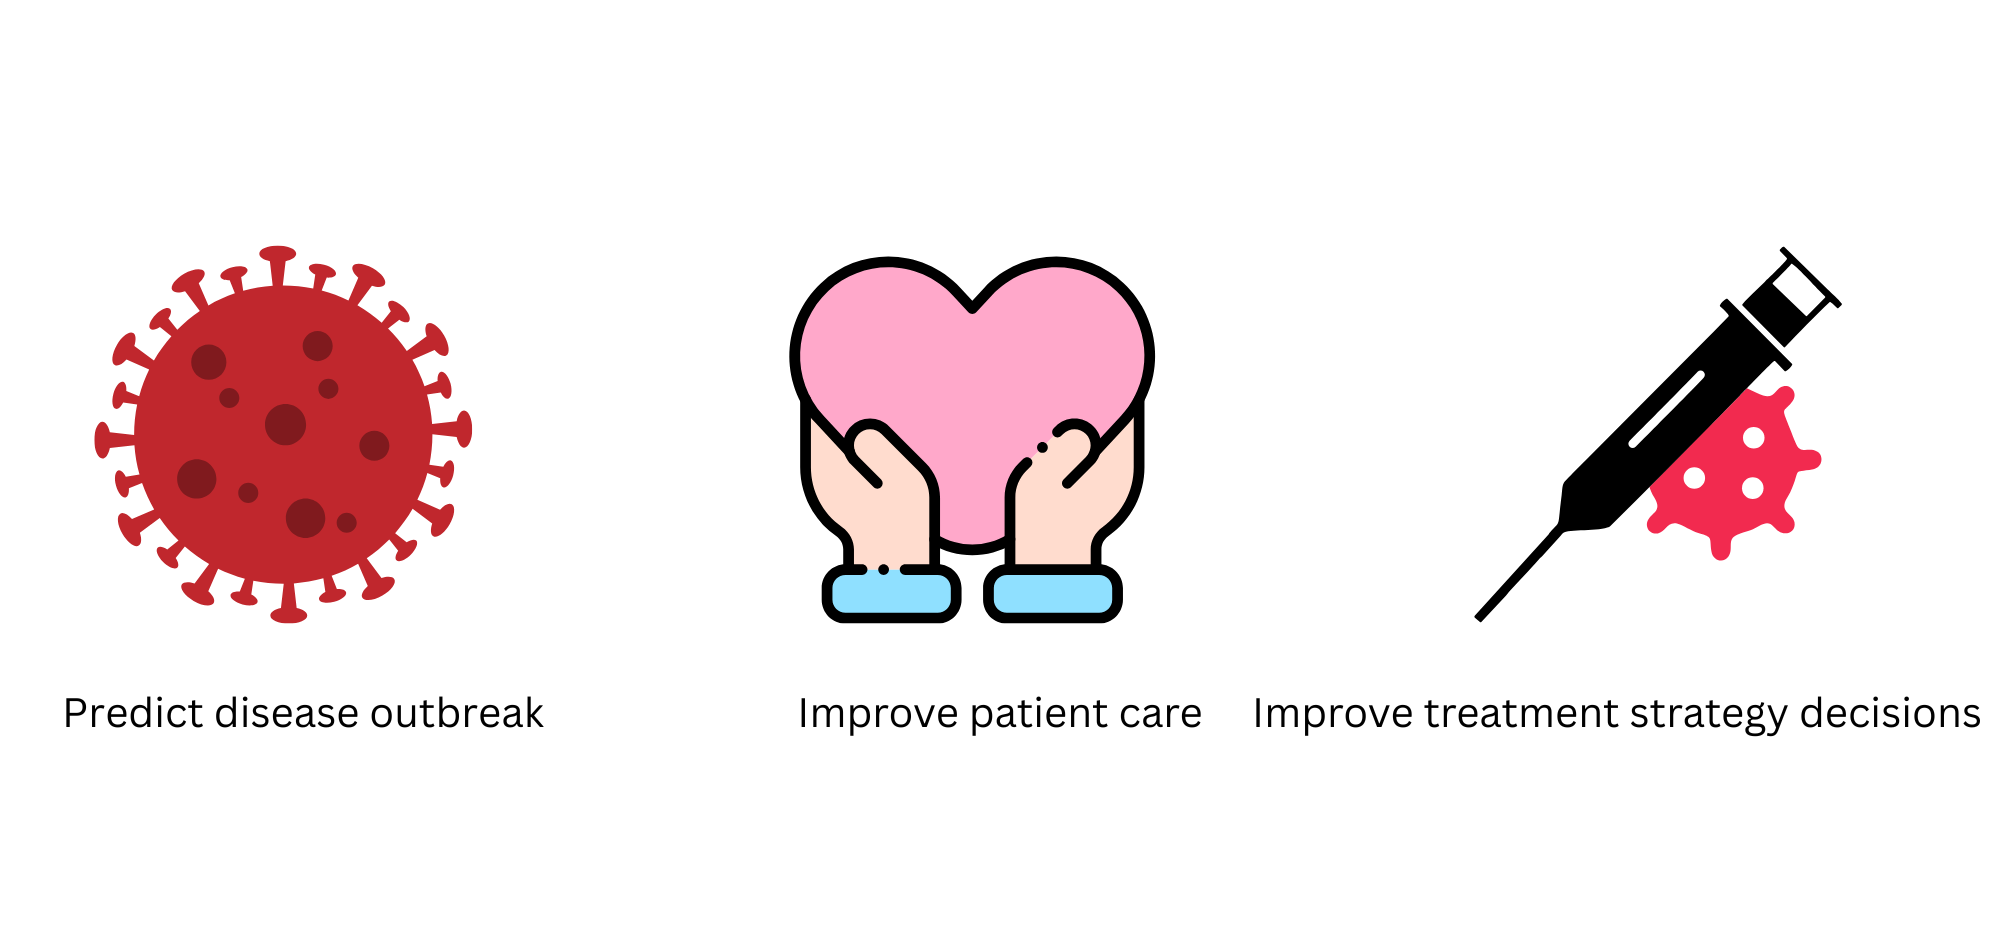
In the healthcare industry, for example, through data analysis, healthcare providers can predict disease outbreaks, improve patient care, and make informed decisions about treatment strategies.
Or, for an e-commerce company, through data analysis, the company can understand its customers' buying behaviour, preferences, and patterns. They can then use this information to personalise customer experiences, forecast sales, and optimise marketing strategies, catapulting business growth and customer satisfaction.
There are 4 different types of data analytics. They guide us on how to look at data in order to answer questions and solve problems. They are:
- Descriptive analytics: Tells us what happened.
Example: Your electricity bill showing how much power you used last month. - Diagnostic analytics: Explains why it happened.
Example: Figuring out your bill went up because you bought and started using an air conditioner. - Predictive analytics: Predicts what is likely to happen in the future. Example: Estimating your next bill based on summer heat trends.
- Prescriptive analytics: Suggests what to do about it.
Example: Recommending you set your AC to 24°C to save money.
The process of data analysis involves the following steps:
Step 1: Define questions
The initial stage of data analysis involves establishing well-defined objectives and creating targeted questions that shape the direction of the analysis. This requires a thorough understanding of the issue, identifying relevant data sources, and selecting appropriate performance indicators. The clearer the questions, the better the direction for your analysis.
Step 2: Data collection
This step involves gathering data by conducting surveys, interviews, and observational studies, as well as extracting information from existing databases. The resulting dataset may be quantitative(numerical) or qualitative(non-numerical), based on the questions that were defined in step 1. A survey of 500 people showing their monthly income, age, and number of hours spent on social media, all in numerical values, is what quantitative datasets look like. Whereas customer feedback comments describing their experience with a product (“The app is easy to use but loads slowly”) are what qualitative datasets look like.
Step 3: Data cleaning
Data cleaning, also referred to as data cleansing, involves identifying inaccuracies and inconsistencies within the dataset and resolving them to preserve data quality and reliability, which ensures accurate and valid analytical outcomes.
Step 4: Data analysis
Data analysis involves applying statistical or mathematical techniques to the data to discover patterns, relationships, or trends. There are various tools and software available for this purpose, such as Python, R, Excel, and specialised software like SPSS and SAS.
Step 5: Presenting findings
Once the analysis is complete, the results need to be interpreted and presented visually. Charts, graphs, and other visuals make complex data easier to understand and clearly communicate the findings.

How AI Fits In
To perform data analysis on your electricity bill, the question to be asked could be, “Why did my bill increase this month, and how can I reduce it?”. Collecting data would involve taking a look at various receipts and metrics, such as past electricity bills, meter readings, weather patterns, and appliance usage. Then, by checking for missing values, correcting errors in readings, and standardising formats, the data is cleaned. With a clean dataset, analysing data can begin to spot patterns, like higher consumption on hot days or increased usage after buying an air conditioner, using tools like Excel or Python. Finally, through simple charts showing usage trends and recommending actions, such as adjusting your AC temperature or using it less during peak hours, to manage future costs, you can present your findings.
Traditionally, analytics involved a lot of manual work with humans combing through spreadsheets and creating charts and graphs. AI changes this by
- Automating repetitive tasks like sorting and cleaning data.
- Spotting patterns humans might miss.
- Learning from history to make predictions.
- Processing massive data far faster than we can.
Specifically, AI helps with the following:
Code Generation and Big fixes
AI coding assistants can speed up code generation, debugging, and documentation for data analysis. Tools like Anaconda Assistant, Jupyter AI, and GitHub Copilot can create code blocks, complete partially written functions, explain complex scripts, and add comments automatically. They are useful for tasks like visualising large datasets or building machine-learning models, and can debug errors without lengthy manual searches. For Excel users, Microsoft 365 Copilot can generate formulas, create macros, and streamline spreadsheet workflows.
Github Copilot assisting with code generation. Tab key helps to accept the predictions
Deeper Analysis
AI can help uncover deeper business insights by explaining trends and anomalies in your data. Tools like Tableau GPT let you ask direct questions—such as “Why did sales drop in March?”, “What caused the spike in users?”, or “Which quarter had the highest revenue?”—and quickly get answers. The AI scans datasets, identifies trends, and finds correlations to explain what is happening. This capability is also valuable for exploratory data analysis, helping you understand new datasets or databases more efficiently.
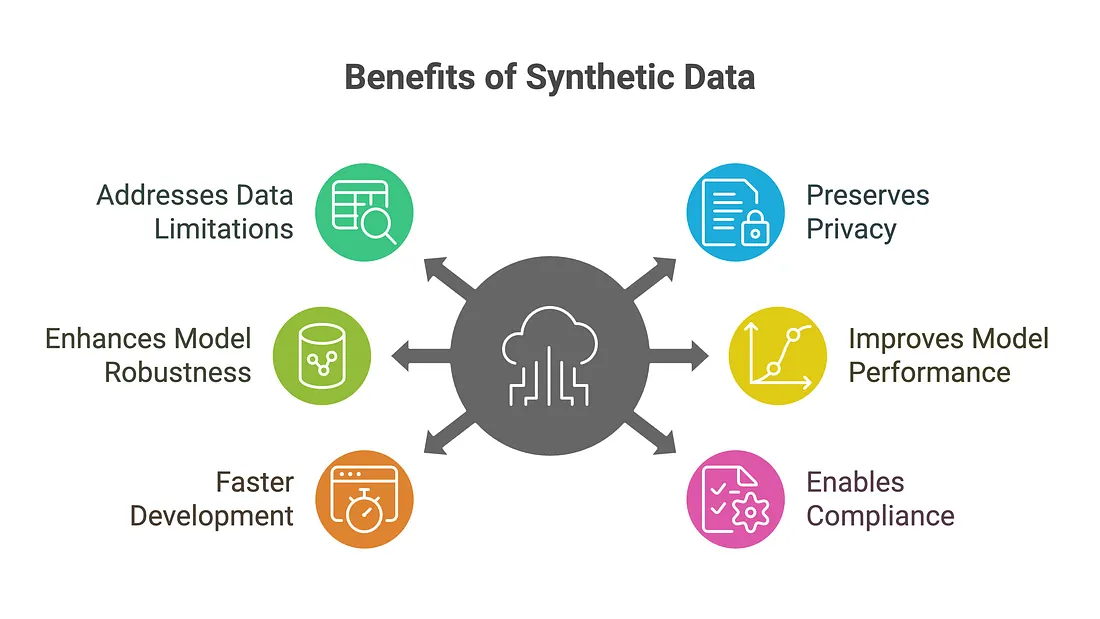
Creation of Synthetic Data
AI can generate synthetic data, which Gartner predicts will be the primary training source for AI models by 2030. This is important for machine learning engineers and data scientists, helping with the creation of training datasets, especially those that are rare or hard to obtain, such as specific images or videos. Tools range from free options like ChatGPT to paid platforms like Mostly AI and Gretel AI. Synthetic data allows for efficient model testing and experimentation. AI can also perform automated data imputation, quickly and accurately filling in missing values or handling outliers, streamlining the data preparation process.
Data Visualisation
AI can simplify the creation of interactive dashboards and reports. Tools like Tableau GPT can quickly combine data from multiple sources and automatically generate clear, user-friendly visualisations, with no prior data visualisation experience required. Simply select your data, and the AI will format it into charts or graphs. For even more aesthetic visualisations, tools like Midjourney can produce visually striking dashboard designs tailored to your analysis.
Data Entry from Images
AI can automate data entry from images, saving analysts hours of manual work. Features like Excel’s “Insert Data from Picture” use computer vision to convert images of tables or documents into editable digital datasets. This is ideal for quickly extracting large volumes of structured data from scanned files, photos, or printed materials. For healthcare providers processing vast numbers of medical scans, such as X-rays or MRIs, this feature allows AI to quickly capture and input essential details with high precision.
Insert Data from Picture on Excel. Some minor manual modifications will be required, but overall, it saves time.
Automated Data Cleaning
AI can enhance data quality by automating the cleaning process—identifying errors, fixing inconsistencies, removing duplicates, and filling missing values. These tools can detect issues like inconsistent date formats, flag outliers, and even suggest corrections. Platforms such as Monte Carlo continuously monitor data quality, eliminating the need for manual testing. By reducing time spent on preparation, analysts can focus on deriving insights, resulting in more accurate and reliable analysis.
Beginner-Friendly Tools
You don’t need to be a data scientist to start analysing data. Many tools make it easy:
- Google Looker Studio – Free dashboards and reports.
- Power BI – Easy drag-and-drop analytics from Microsoft.
- Tableau Public – Create interactive visualisations.
- ChatGPT / Microsoft Copilot – Ask questions about your data in plain English.
Conclusion
In today’s data driven world, turning raw information into actionable insights is no longer optional. It has become mandatory to keep up with growing demands and needs. AI is transforming data analytics by automating tedious tasks, uncovering patterns not obvious to the human eye, and making advanced techniques accessible to everyone. From generating synthetic data to creating interactive dashboards, cleaning messy datasets, and even extracting information from images, AI helps analysts and non-specialists alike to work faster, smarter, and with greater accuracy. As AI tools continue to evolve, the ability to harness them effectively will be a key skill for businesses and individuals who want to stay competitive, make informed decisions, and unlock the full potential of their data.
References
- Crabtree, M. (2023). What is Data Analysis? An Expert Guide With Examples. https://www.datacamp.com/blog/what-is-data-analysis-expert-guide.
- Coursera Staff (2023). What Is Data Analytics?https://www.coursera.org/articles/data-analytics.
- Chia, A. (2023). 6 Unique Ways to Use AI in Data Analytics. https://www.datacamp.com/blog/unique-ways-to-use-ai-in-data-analytics.


