

Uncovering The Secrets Behind The Most Influential Scholarly Publications With AceMap
Understanding Knowledge Networks From A Graph Perspective
-

- •

Introduction
Since 2020, over ten million scholarly articles have been published annually. To put that into perspective, say all ten million articles were released on the first day of the year. To get through them all, you would have to read about 27,397 articles every single day. Even if you were only interested in a specific field like artificial intelligence (AI), with 242,375 articles about AI in AceMap’s database in 2020 alone, that is still 664 articles daily.
We all agree that this is a staggering volume of articles that poses significant issues. For instance, governments struggle to choose which endeavours to allocate research funding to. Organisations face difficulties in recognising influential works deserving of awards like Turing Awards or Nobel Prizes. Researchers grapple with identifying research trends to do further exploration. Several factors make this more challenging:
- The structure of platforms that researchers commonly turn to, such as academic search engines like Google Scholar or pre-print platforms like arXiv, lack the structure to easily analyse interactions between publications and academic entities. Imagine you were given a long list of PDF documents, it would be hard to connect them all to spot trends or to compare them.
- Current metrics like citation counts only partially capture a paper’s impact.
- Tools for citation analysis, such as CiteSpace and CitNetExplorer, do not specifically identify or quantify the influence of publications.
This article will review the AceMap system and introduce several features of the AceMap interface. Then, the Scientific X-ray framework, designed to quantify the influence of publications using AceMap data, will be introduced with some interesting findings.
What Is AceMap?
AceMap is a database system that connects academic entities in a knowledge graph called AceKG (AceMap Knowledge Graph). Containing more than 221 million papers from 1800 to 2021, by more than 103 million authors across 767 thousand different research fields, AceMap was designed to address four fundamental questions:
- How do we effectively represent complex interactions between entities?
- What is an intuitive method to represent the structure of the scholarly network?
- How can we measure the knowledge possessed by entities for comparison?
- How can we analyse these networks and present the findings in a digestible way?
We will briefly discuss each of these aspects in relation to AceMap’s features.
1. How do we effectively represent complex interactions between entities?
AceMap is built on AceKG, and a diagram of its main components is shown in the image below. The graph comprises five classes of entities represented by icons — papers, authors, venues, fields of study and institutes — totalling over 114 million entities. Each entity has several properties such as name or publish date, represented by hollow circles, while the relationships between entities are represented by black arrows.
This graphical representation allows further connections to be made:
- Topic Tree: Hierarchical relationships can be formed by studying co-occurrence of concepts. For instance, the field of model-based reasoning, which is an inference method for artificial intelligence systems to model the real world, has the following parent and children topics.
- Tracing and Evolution Tree: Accessible from the IdeaReader section of each publication’s webpage, the tracing tree details past papers that motivated the current paper, while the evolution tree maps out the current paper’s influence on subsequent works.
- Paper Map of Field: Papers that define every field, like “Model-based reasoning” in the example here, are listed out based on first authors. The links between these papers are represented as well.
- DeepReport: This novel research assistant system analyses co-occurrence and convergence of concepts to identify new ideas by combining current ones.
The details of the many natural language processing, data extraction, and other machine learning techniques that were employed to construct AceKG can be found in the AceMap paper itself (see the references in the last section of this post).
2. What is an intuitive method to represent the structure of the scholarly network?
Existing visualisation methods were inadequate to display the vastness of AceKG, as they handle only up to hundreds of thousands of nodes, far from AceKG’s millions. Instead, a new method called VSAN (Visualising Super-Large Academic Networks) was proposed. Essentially, the graph was divided into smaller segments which were displayed separately and stitched together.
Four million nodes and 36 million edges from the DBLP computer science bibliography were mapped onto a galaxy-like graph. In the image below, in panel (c), computer vision conferences like CVPR and ICCV were clearly clustered. Panels (d) and (e) show topic clusters in the computer networks field and in an information theory journal.
3. How can we measure the knowledge possessed by entities for comparison?
Instead of using citation-based metrics to measure knowledge, the Knowledge Quantification Index (KQI) based on entropy was proposed. A higher KQI is assigned to publications with better acceptability and dependability, meaning the paper was derived from reliable parent knowledge and inspires numerous subsequent works. KQI offers several advantages over other metrics:
- It considers the flow of ideas from paper to paper.
- It cannot be manipulated by self-citation or citation stacking, wherein authors repeatedly cite their own works to inflate citation counts.
- It can pinpoint valuable knowledge.
In fact, when ordering the top 10,000 authors by KQI from their computer science dataset, the creators of AceMap identified 71 Turing Award winners, amounting to 96% of all winners up to 2020.
4. How can we analyse these networks and present the findings in a digestible way?
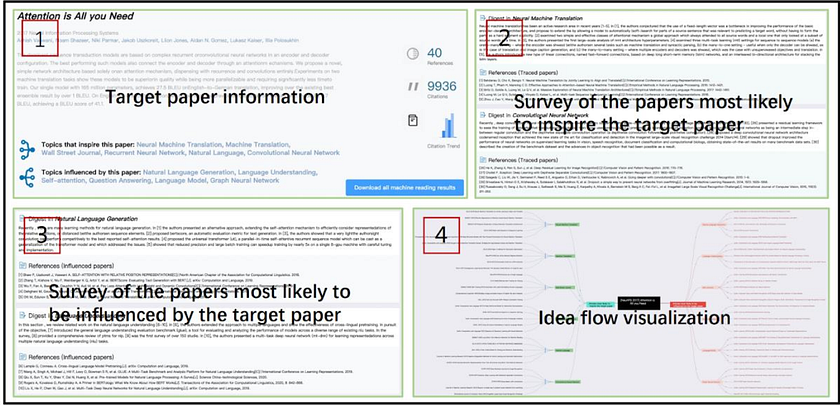
Besides the numerous graphs and charts presented on the AceMap website, there is an additional feature called IdeaReader. In a snapshot of IdeaReader’s interface below, information regarding the target paper is provided to the user in panel (1), including the list of authors, abstract and several metrics. IdeaReader identifies papers most likely to inspire or be influenced by the target publication. Automatically generated summaries of the top five papers in these two groups are provided in panels (2) and (3). The flow of ideas from papers before and after the target paper are also given in panel (4).
Scientific X-ray: A Framework Built on AceMap’s Database
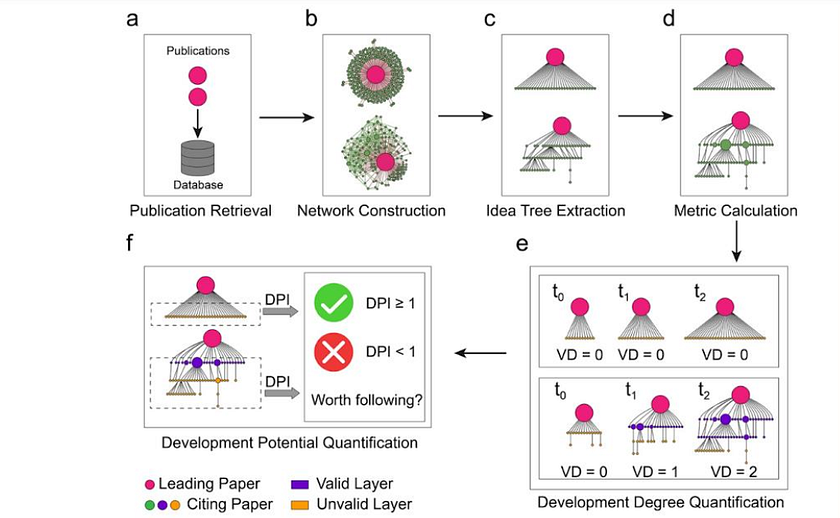
In 2022, the Scientific X-ray framework was proposed by Li and colleagues to help evaluate the development and potential of ideas, to identify them amidst the vast array of publications. Citation networks (depicted as tree structures in the image) were constructed for each target publication (depicted as pink circles). Distinct network structures were observed for different publications, like the top structure in panel (b) in the image below representing summative work like textbooks, and the bottom structure showing innovative research. The ‘idea’ tree in panel (c) was formed to represent the flow of ideas to subsequent papers. Based on these trees, three metrics were introduced:
- Knowledge Entropy (KE): Quantifies knowledge within a paper based on its tree’s structure.
- Valid Depth (VD): Measures the degree of development of the target publication’s idea.
- Development Potential Index (DPI): Assesses future potential of the target publication’s idea.
Noteworthy findings were discovered using these metrics. Firstly, a significant proportion (31.11%) of publications had a VD of zero, showing challenges in new knowledge being adopted. Secondly, although citation counts could increase indefinitely, 99% of publications could not exceed the upper bound of influence at a VD of six. Furthermore, the evolution of ideas across disciplines followed six distinct patterns automatically derived from idea trees:
- Summative work, like textbooks, lacked the ability to inspire future works or foster new ideas.
- Continued development of a target article’s idea needed subsequent works which were also influential.
- A relay of influential subsequent works was necessary for the continued development of the target publication’s idea.
- Subsequent work that overshadowed the target publication caused the original idea to lose relevance and attention.
- If two branches of thought followed from the target publication, the dominance of one branch impeded development in the second branch.
- Publications approaching the upper limit of development required many influential subsequent works to sustain progress.
Meanwhile, by assessing DPI, Scientific X-ray accurately identified 40 out of 49 Nobel Prize topics in Physics, Chemistry, and Physiology or Medicine from 1900 to 2016, demonstrating the effectiveness of DPI in predicting the influence of scientific ideas.
Conclusion
We have introduced the AceMap system, which relies on the knowledge graph AceKG, showcasing various features including the tracing and evolution trees, IdeaReader, and DeepReport. A new visualisation technique for massive graphs, Visualising Super-Large Academic Networks (VSAN), was presented. We also discussed the Scientific X-ray framework based on AceMap data and presented six interesting patterns regarding idea development in scientific research. Furthermore, we explored four novel metrics — the Knowledge Quantification Index (KQI), Knowledge Entropy (KE), Valid Depth (VD), and Development Potential Index (DPI) — as means to measure the knowledge, development, and potential of publications.
References
- Wang, X., Fu, L., Gan, X., Wen, Y., Zheng, G., Ding, J., Xiang, L., Ye, N., Jin, M., Liang, S., Lu, B., Wang, H., Xu, Y., Deng, C., Zhang, S., Kang, H., Wang, X., Li, Q., Guo, Z., … Zhou, C. (2024). AceMap: Knowledge Discovery through Academic Graph (Version 1). arXiv. https://doi.org/10.48550/ARXIV.2403.02576
- Li, Q., Wang, X., Fu, L., Wang, J., Yao, L., Gan, X., & Zhou, C. (2022). Scientific X-ray: Scanning and quantifying the idea evolution of scientific publications. In E. Caroselli (Ed.), PLOS ONE (Vol. 17, Issue 9, p. e0275192). Public Library of Science (PLoS). https://doi.org/10.1371/journal.pone.0275192
Catch the latest version of this article over on Medium.com. Hit the button below to join our readers there.


